| NOTE:
This Mandelbrot explorer has an end because it is only for demonstration purposes.
This Mandelbrot Explorer does not even remotely come close to fully representing
the power and vastness of what Fractals can do and really are in mathematics
(geometry). This Fractal Explorer will not magnify once one value goes past
E -15.
History of fractals
The Mandelbrot set--named after the man who accidentally
discovered and coined the term "Fractals" in the early 1970's--is one of the
most beautiful and profound discoveries in the history of mathematics.
Not since Pythagoras and the Greeks (circa 600 B.C.) who documented all their
mathematical breakthroughs has there been such a revolutionary discovery.
After his discovery, Benoit Mandelbrot used the
Latin term "fractus," which means broken or irregular, to name fractals and
called the new science the term "Fractals" because of the abstract fractional
characteristics the formula produces.
Fractals were not discovered until the invention
of computers. It was virtually impossible to discover fractals before
the advent of the computer because of their complexity and gargantuan output.
Fractals existed only in theory before the computer and were published in a
most basic form in 1918 by Gaston Julia. They were later published in
an advanced form in 1925. It is from this advanced formula that Benoit
Mandelbrot made his now famous and revolutionary discovery.
The following is from:
Stephen Wolfram, A New Kind of Science
Notes for Chapter 5: Two Dimensions and Beyond
Section: Substitution Systems and Fractals Page 934
The idea of using nested 2D shapes in art probably goes back to antiquity; some
examples were shown on page 43. In mathematics, nested shapes began to be used
at the end of the 1800s, mainly as counterexamples to ideas about continuity
that had grown out of work on calculus. The first examples were graphs of functions:
the curve on page 920 was discussed by Bernhard Riemann in 1861 and by Karl
Weierstrass in 1872. Later came geometrical figures: example (c) on page 191
was introduced by Helge von Koch in 1906, the example on page 187 by Waclaw
Sierpinski in 1916, examples (a) and (c) on page 188 by Karl Menger in 1926
and the example on page 190 by Paul L�vy in 1937. Similar figures were also
produced independently in the 1960s in the course of early experiments with
computer graphics, primarily at MIT. From the point of view of mathematics,
however, nested shapes tended to be viewed as rare and pathological examples,
of no general significance. But the crucial idea that was developed by Benoit
Mandelbrot in the late 1960s and early 1970s was that in fact nested shapes
can be identified in a great many natural systems and in several branches of
mathematics. Using early raster-based computer display technology, Mandelbrot
was able to produce striking pictures of what he called fractals. And following
the publication of Mandelbrot�s 1975 book, interest in fractals increased rapidly.
Quantitative comparisons of pure power laws implied by the simplest fractals
with observations of natural systems have had somewhat mixed success, leading
to the introduction of multifractals with more parameters, but Mandelbrot�s
general idea of the importance of fractals is now well established in both science
and mathematics.
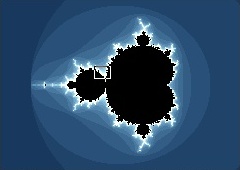
The fractal universe
Fractals, so far, appear to have no end and continue
into true infinity. There are, however, points on the geometric phenomena
that boil down to zero (the black area). All other areas that work toward
infinity are represented in various colors depending on how fast they fade in
or out of view.
Fractals, in mathematics, are geometric shapes
that are complex and detailed in structure at any level of magnification. Often
fractals are self-similar�that is, they have the property that each small portion
of the fractal can be viewed as a reduced-scale replica of the whole. One example
of a fractal is the �snowflake� curve constructed by taking an equilateral triangle
and repeatedly erecting smaller equilateral triangles on the middle third of
the progressively smaller sides. Theoretically, the result would be a figure
of finite area but with a perimeter of infinite length, consisting of an infinite
number of vertices. In mathematical terms, such a curve cannot be differentiated
(see Calculus). Many such self-repeating figures can be constructed, and since
they first appeared in the 19th century they have been considered as merely
bizarre.
Fractal geometry is not simply an abstract development. A coastline, if measured
down to its least irregularity, would tend toward infinite length just as does
the �snowflake� curve. Mandelbrot has suggested that mountains, clouds, aggregates,
galaxy clusters, and other natural phenomena are similarly fractal in nature,
and fractal geometry's application in the sciences has become a rapidly expanding
field.
Practical use of fractals today
The beauty of fractals has made them a key element in computer graphics.
Fractals have also been used to compress still and video images on computers.
In 1987, English-born mathematician Dr. Michael F. Barnsley discovered the Fractal
Transform� which automatically detects fractal
codes in real-world images (digitized photographs). The discovery spawned fractal
image compression, used in a variety of multimedia and other image-based computer
applications.
Mathematics and the fractal
Fractals are found within a branch of mathematics
(geometry) concerned with irregular patterns made of parts that are in some
way similar to the whole, e.g., twigs and tree branches, a property called self-similarity
or self-symmetry. Unlike conventional geometry , which is concerned with regular
shapes and whole-number dimensions, such as lines (one-dimensional) and cones
(three-dimensional), fractal geometry deals with shapes found in nature that
have non-integer, or fractal, dimensions�line-like rivers with a fractal dimension
of about 1.2618 and cone-like mountains with a fractal dimension between 2 and
3. Fractal geometry developed from Benoit Mandelbrot's study of complexity and
chaos (see chaos theory).
Julia sets
Julia sets sit in the complex plane, where the
horizontal axis represents real numbers, and the vertical axis represents imaginary
numbers. Each Julia set (there are an infinite number) is determined by its
constant value, c, which is a complex number. Now imagine you take another
complex number, z. You will run this number through the following iterative
equation.
The formula behind fractals
The simple formula first used by Benoit Mandelbrot:
Z
 Z2 + C
(Z equals Z squared plus C)
Z2 + C
(Z equals Z squared plus C)
...is the "recipe" for an extremely complicated
output.
The formula used in the Mandelbrot Set is an iterative
formula.
That is to say, the meaning of iteration is: a
procedure in which repetition of a sequence of operations yields results successively
closer to a desired result.
This "recipe" or formula will carry out a set
of instructions until the parameters change, continue with secondary instructions
until the parameters change again, and will do so until the sequence of operations
is complete (including third, forth, fifth, sixth set of instructions, etc.
if applicable).
The discovery of fractals
A turning point in the study of fractals came
with the discovery of fractal geometry by the Polish-born French mathematician
Benoit B. Mandelbrot in the 1970s. Mandelbrot adopted a much more abstract definition
of dimension than that used in Euclidean geometry, stating that the dimension
of a fractal must be used as an exponent when measuring its size. The result
is that a fractal cannot be treated as existing strictly in one, two, or any
other whole-number dimensions. Instead, it must be handled mathematically as
though it has some fractional dimension. The �snowflake� curve of fractals has
a dimension of 1.2618.
Mandelbrot biography
Benoit B. Mandelbrot - 1924-,
French mathematician, born in Warsaw, Poland on November 20, 1924 to a Jewish
family originally from Lithuania. He moved to France in 1936 and in 1944 entered
college under Gaston Julia. Later, he worked at an IBM research center and studied
chaotic data in economics.
Largely self-taught and considered a maverick
in the field of mathematics, he is uncomfortable with the rigorously pure logical
analysis prescribed by Nicolas Bourbaki and relies instead on his talent for
visualizing natural phenomena. A pioneer of chaos theory , he conceived, developed,
and applied fractal geometry , which is used to find order in apparently erratic
shapes and processes.
Beginning in 1961, Benoit Mandelbrot published
a series of studies on fluctuations of the stock market, the turbulent motion
of fluids, the distribution of galaxies in the universe, and on irregular shorelines
on the English coast. By 1975 Mandelbrot had developed a theory of fractals
that became a serious subject for mathematical study. Fractal geometry has been
applied to such diverse fields as the stock market, chemical industry, meteorology,
and computer graphics .
|